


At the turn of the 20th Century, Civil rights activities and Atlanta university Prof WEB du Bois, produced The Exhibit of African-American Lifethat was displayed at the 1900 Paris Exposition. It was a brilliant collection of manually produced infographics showing the lived experiences of Black Americans over many decades through powerful, incontestable data.
We have always had a close relationship with numbers long before anyone had ever heard of Big Data. Parents have always captured milestones in their children’s development – first words, first steps etc. and numbers are our go to if we want a better understanding of pretty much anything from running to improved sleep to social media posts to most forms of performance indicators.
I’ve borrowed the title from people like the amazing Brené Brown and Sarojini Nadar (2014) who explain that data gives a window to the story, the narrative, the journey. And it is this journey that should align to mission statements of any organisation whether that be to sell more sandwiches (Pret), improve academic grades (schools) or support more young people to have a positive relationship with physical activity (Physical Education).
We widely claim that PE is a gateway to physical activity beyond the school gates and beyond school years. Our vernacular is littered with expressions like healthy active lives and lifelong participation. And PA is considered to be a wholly good thing that brings with it a plethora of benefits that are widely claimed by PE. Apart from the widely cited Bailey et al article, this is clearly seen in the language of the Daily Mile website which should be read with Thorburn’s critique (2020).
I remember at a parents’ evening for my child in Year 2 being told by the teacher how many high frequency words he could read. The vocabulary gap between children from various backgrounds is well documented. Way back in the 1960s, Basil Bernstein produced his seminal work that highlighted how language reinforces class discrimination.
Interestingly, I’m not aware of studies that look at disparities in movement opportunities and indeed movement vocabulary or of schools who record high frequency movements. We should, however, know which students move frequently and happily (and which do not).
miMove is an app that allows schools to have precisely that data, by way of students self reporting all of their physical activity experiences both in and out of school, in formal or informal settings, in sport, dance or exercise. In short, whatever they do, they post on their miMove account and teachers can log in to the webapp to view and learn from this data. This is giving schools and PE departments, in particular, volumes of information about each and every student that has previously not been available.
Having this knowledge is one thing, knowing how to respond to it is quite another (especially when it’s new) so I would like to examine the type of stories that miMove is telling and how some schools have responded to it.
Early adopters are people who see very quickly why a new product (often tech) can bring various benefits to their lives. One such PErson is the recently announced High School Teacher of the Year (KY), Jordan Manley. Jordan has built a physical education programme that focuses on the big picture.
His programme centres on students becoming the owners of their own physical activity journey. When Jordan heard about miMove, it was a no brainer. He no longer had to use clumsy activity journals which saved him and his students hours. The key feature of Jordan’s approach is the degree of student autonomy, responsibility and accountability. So the primary owner of the data and the primary teller of the story is the student. However, Jordan checks in with the teacher web app regularly and through the messaging function he is able to motivate, support and celebrate his students’ efforts. The students use the app to ‘defend’ their learning over the course of the module in which they reflect on how, why, when and where they engage with physical activity and what they may have learnt about themselves on the way.
Jordan’s programme is, in many ways, quite radical. If you are not looking to, or are not permitted to make such major changes, gaining insight data completes the cycle between intent, implementation and impact to produce an ever evolving but coherent roadmap.
Again, let’s examine some examples. The key question is how would you use the data below to support your professional decision making?
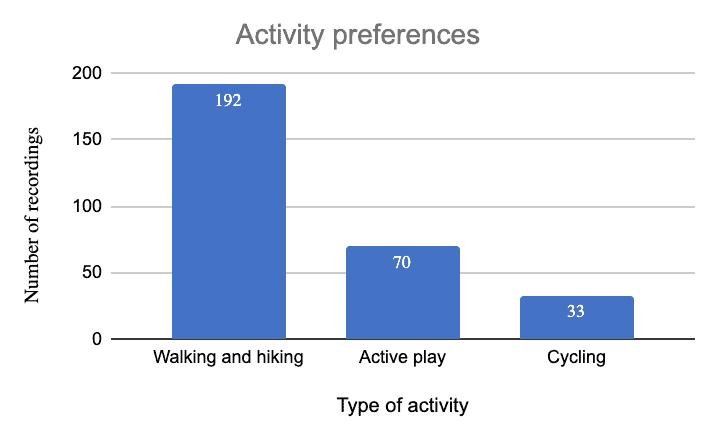
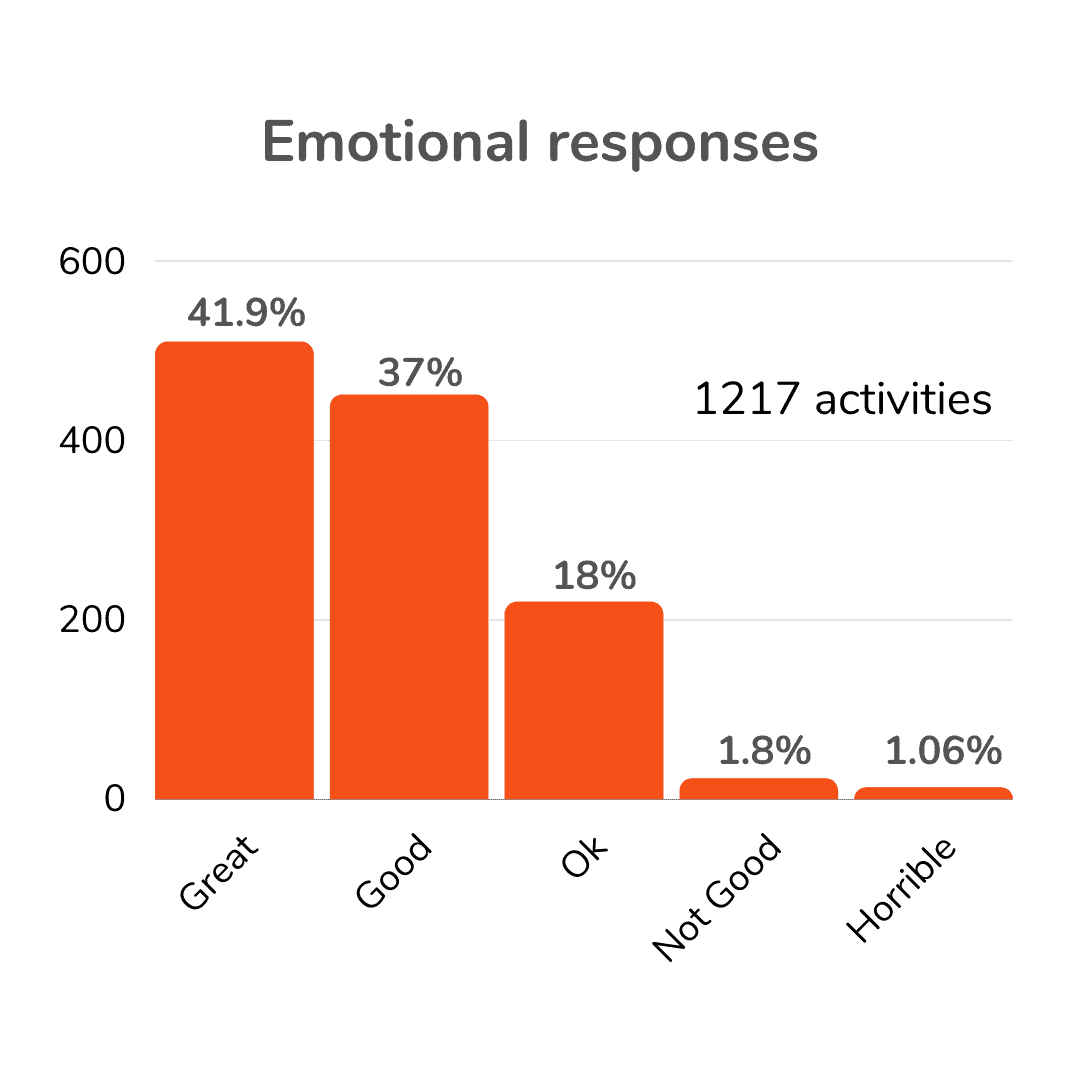
Physical education has always aspired to impact participation beyond the school gates and beyond the school years. The above graph is taken from a secondary school in London. It shows the top 3 activities recorded by Year 8 students over the course of a weekend. On the face of it there appears to be a mismatch between activities taught and those which the students take part in during their free time. Of course, participation patterns are complex and factors such as accessibility of local provision would impact. However, the department was, not surprisingly, keen to read this data together with the chart below, which suggests that the vast majority of students are having a positive experience in their lessons.
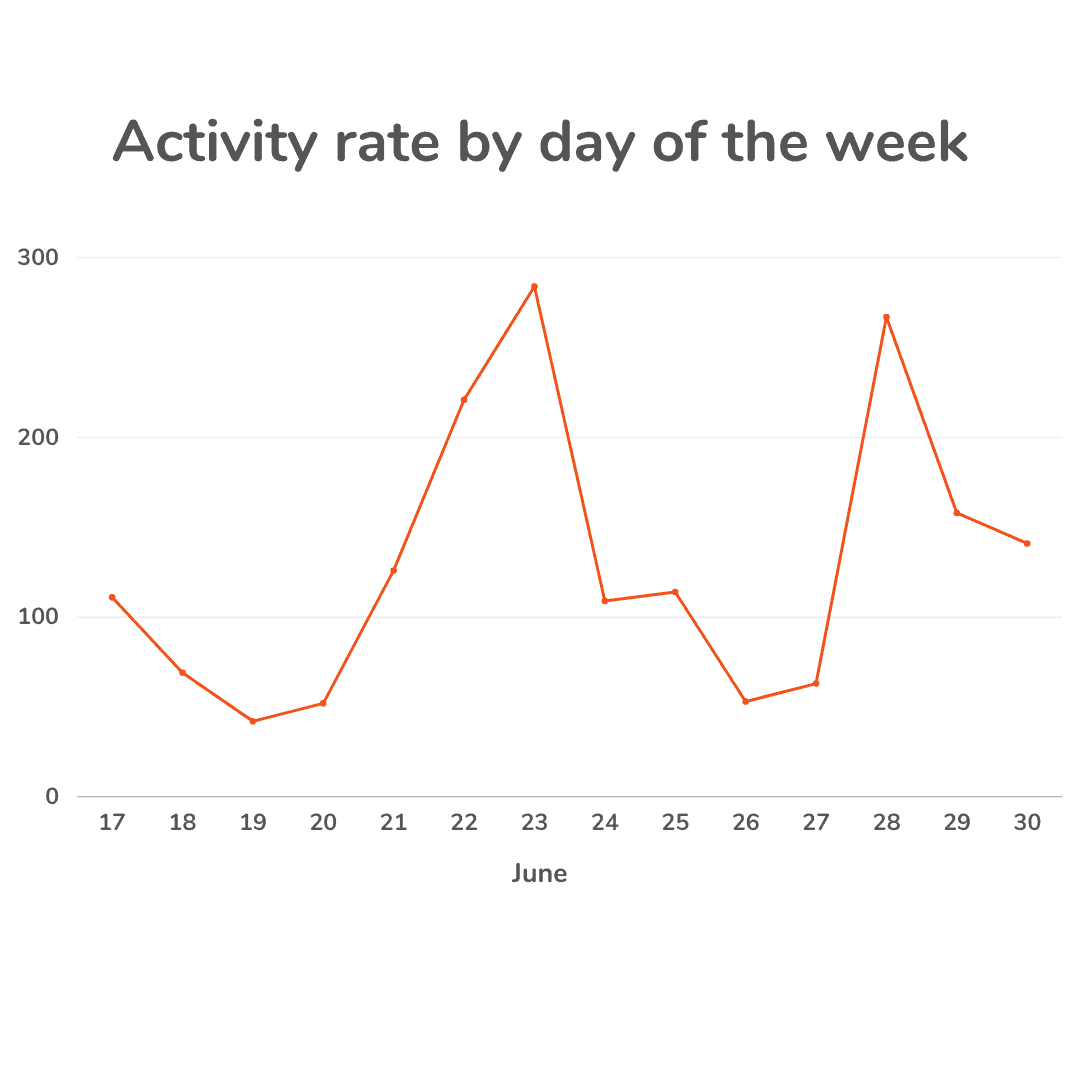
A similar scenario was evident in another school in another part of the country. They noticed that their students were far less active on the weekends compared to during the school week. They hypothesised that this was down to the pandemic – student leisure time habits and routines had been altered by the hiatus caused by lockdown coupled with changes in parent/carer income (See Kirk’s Precarity for a brilliant analysis of the how uncertain working hours and income impacts on participation).
However, the team also had strong evidence to show that their work and the opportunities they were providing had become even more important to their students’ lives, perhaps disproportionately so. This was communicated up to senior management and taken into consideration as the school planned it’s ‘new normal’.
We all know that our subject is not always seen as of equal importance to others. It could be argued that we are part of the problem. For example, what do we communicate as our successes? If a parent or colleague reads the school newsletter do they ever see stories beyond match reports from PE? How does this sit with widely seen, inclusive mission statements that refer to all students developing a lifelong love of movement and physical activity? The data that miMove provides can help showcase and celebrate inclusive, learner focussed work. The graphic below shows the result of a concerted effort by the PE department of a large school in Yorkshire. The team was focussing on gender equity as there was a perception that their girls were far less active than their boys (as is the case pretty much around the world according to a plethora of reports and research ). However, by re-framing physical activity to challenge the hierarchy that performance sport equals physical activity, a different story began to emerge. On deeper examination of the miMove data, the department was able to get a much fuller picture of how their girls were engaging with physical activity. Here is the activity rates by gender taken from their miMove data.
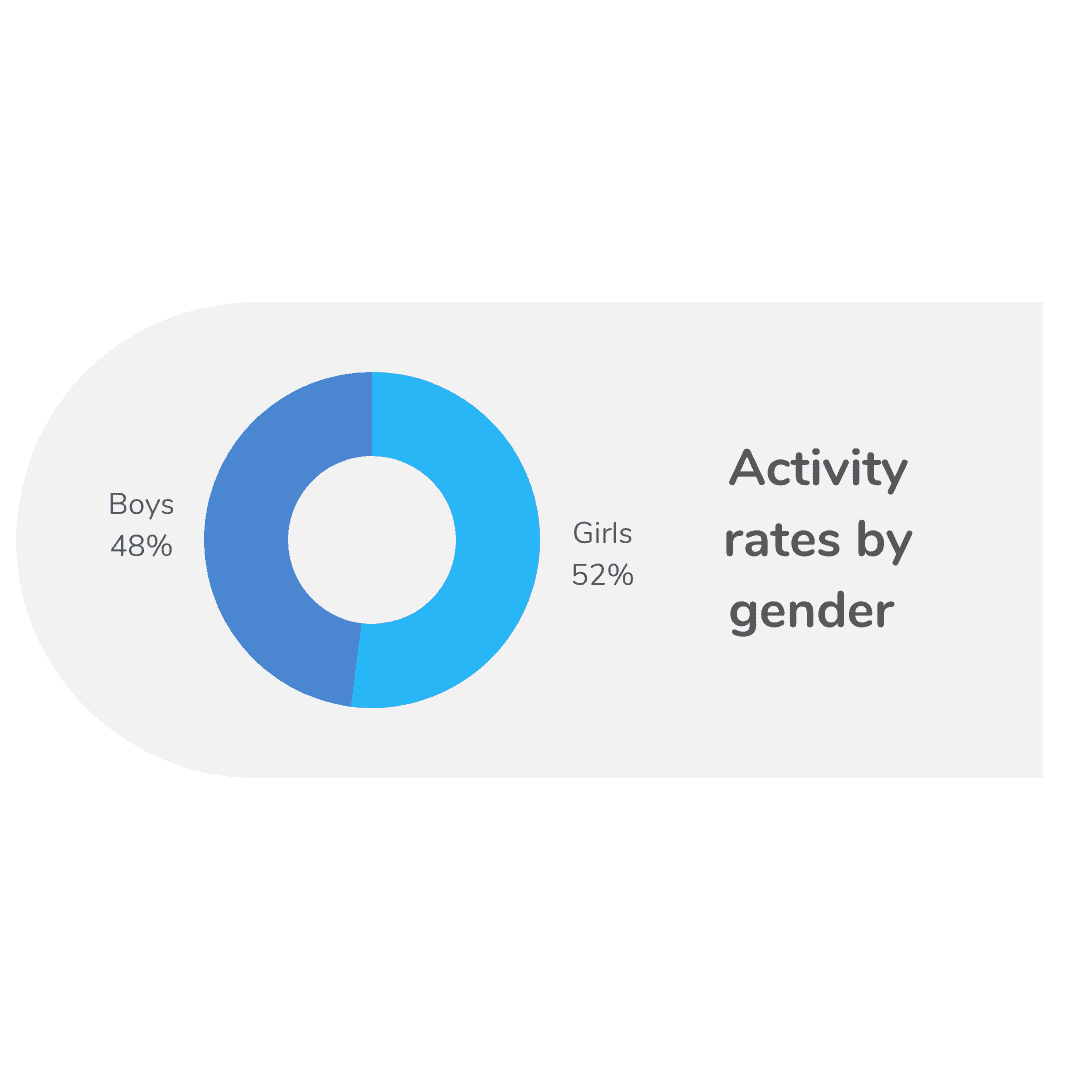
Compare with this graph showing the ongoing activity gulf by gender (Van Sluijs et al, 2021)

The school’s data highlighted a broad range of activities in which informal, unstructured activity featured prominently. This is very much in line with the wonderful work of Justen O’Connor and Dawn Penney that challenges us to consider what a PE programme might look like that prepares students for this type of personally relevant activity. But as well as prompting grand philosophical questions, the data had a more tangible effect – it allowed the department to redefine what constitutes success and connect to girls who they previously perceived to have little interest in what PE had to offer. The data had soul!
I have focussed here on the topline data that miMove brings to your computer screen in a few clicks, to allow you to better understand the impact of your work. It also gives you unprecedented glimpses into the individual stories of your students and how they might be finding meaning (or not) in physical activity. This is discussed in this blog.
About the Author:
This guest blog was written by Greg Dryer – physical educator, teacher educator and Co-Founder of miMove.
Greg is a distinguished physical educator. Throughout his career, his driving passion has been to ensure that all young people have the opportunity to reap the multiple benefits of physical activity.
He has extensive experience in the field, working with three year olds through to postgraduates. He led the PE departments of three large London secondary schools before moving into Higher Education. Most recently, he was Founder and Director of the Centre for Physical Education, Sport and Activity at Kingston University, London. He has authored resources and curricula for students in India and the UK. His ongoing research and practice in supporting young people develop a physical activity habit, highlights the need for practitioners to be able to measure the impact of their work. miMove is the solution.
For further information please visit www.mimoveapp.com or contact [email protected]
References
Bernstein, B. (1971). Class, Codes and Control (Volume 1). London: Routledge & Kegan Paul.
Kirk, D 2019, Precarity, Critical Pedagogy and Physical Education. London.
Nadar, S. (2014). “Stories are data with Soul” – lessons from black feminist epistemology. Agenda. 28. 10.1080/10130950.2014.871838.
O’Connor, J & Penney, D. (2021), ‘Informal sport and curriculum futures: an investigation of the knowledge, skills and understandings for participation and the possibilities for physical education’, European Physical Education Review, vol. 27, no. 1, pp. 3-26. https://journals.sagepub.com/doi/10.1177/1356336X20915937
Thorburn, M. (2020), ‘A critical review of the Daily Mile programme as a contributor to lifelong physical activity’, International Journal of Lifelong Education. https://www.tandfonline.com/doi/abs/10.1080/02601370.2020.1765890?journalCode=tled20
Van Sluijs, E., Ekelund, U., Crochemore-Silva, I., Guthold, R., Ha, A., Lubans, D., Oyeyemi, A. L., et al. (2021). Physical activity behaviours in adolescence: current evidence and opportunities for intervention.. Lancet (London, England), 398 (10298), 429-442. https://doi.org/10.1016/s0140-6736(21)01259-9
Responses